Efficiency
Memorization
使用记忆化优化斐波那契数组
1
2
3
4
5
6
7
8
9
10
11
12
13
14
15
16
17
18
19
20
21
22
23
24
def fib (n ): if n==0 or n==1 : return n else : return fib(n-2 )+fib(n-1 ) def count (f ): def counted (n ): counted.call_count +=1 return f(n) counted.call_count = 0 return counted def memo (f ): cache={} def memoized (n ): if n not in cache: cache[n] = f(n) return cache[n] return memoized fib = count(fib) counted_fib =fib fib = memo(fib) fib = count(fib) print (fib(30 ))print ("origin:" , fib.call_count, "memorized:" , counted_fib.call_count)
832040
origin: 59 memorized: 31
Exponentiation
优化指数运算至
1
2
3
4
5
6
7
8
9
10
11
12
13
14
15
16
17
18
19
20
21
22
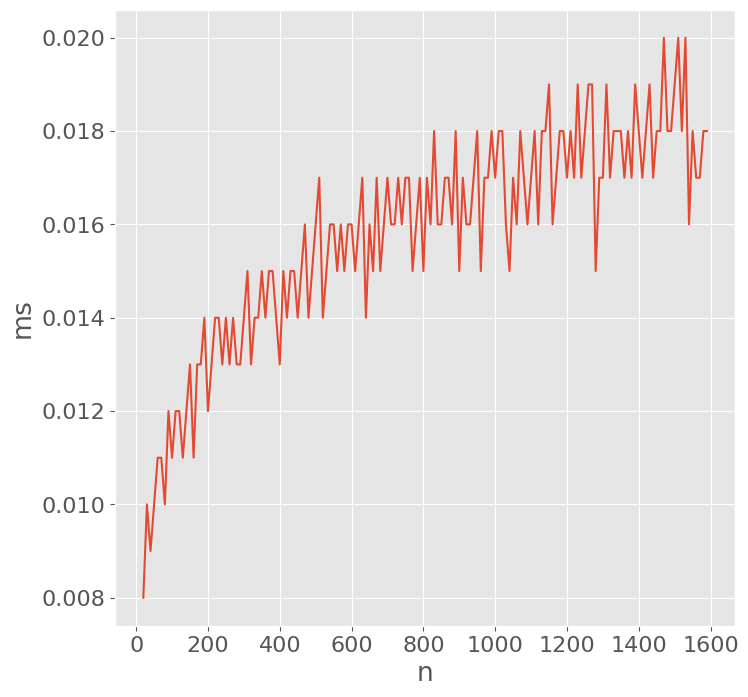
%matplotlib inline import matplotlib.pyplot as pltplt.style.use('ggplot' ) plt.rc('font' , size = 16 ) from timeit import repeatfrom numpy import median, percentiledef plot_times (name, xs, n=15 ): f = lambda x: name+'(' +str (x)+')' g = globals () samples = [] for _ in range (n): times = lambda x: repeat(f(x), globals = g, number = 1 , repeat = n) samples.append([median(times(x)) for x in xs]) ys = [10e3 *median(sample) for sample in zip (*samples)] plt.figure(figsize=(8 , 8 )) plt.plot(xs, ys) plt.xlabel('n' ) plt.ylabel('ms' )
1
2
3
4
5
6
7
8
9
10
def exp_fast (b,n ): if n==0 : return 1 elif n%2 ==0 : return square(exp_fast(b,n//2 )) else : return b*exp_fast(b, n-1 ) def square (x ): return x*x
1
2
exp_2_fast = lambda n: exp_fast(2.0 , n) plot_times('exp_2_fast' , range (20 , 1600 , 10 ))
Order of Growth Notation
时间复杂度常用大O与大
Space
Active environment: - 正在被调用的函数的环境 -
函数的父函数在活动环境中(即嵌套函数内层调用时)
python会自动检测非活动环境并将其回收